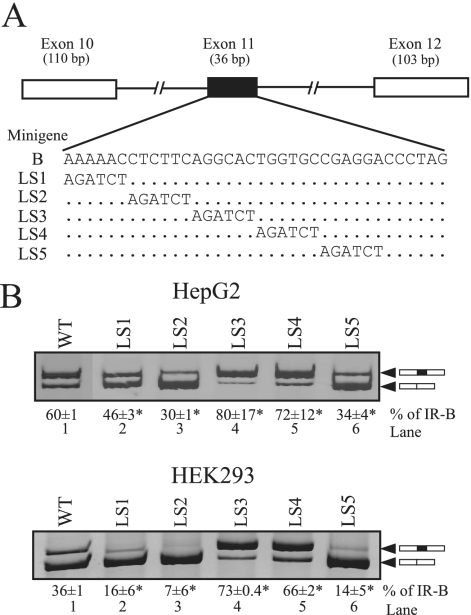
FIG. 1.
Linker-scanning mutagenesis of exon 11 identifies both ESEs and an ESS. (A) Schematic of the IR minigene carrying exons 10, 11, and 12, with the wild-type sequence of exon 11 (row B) and the linker-scanning (LS) substitutions shown below. All mutant constructs are the same length as the wild-type minigene. (B) Spliced products from the wild-type minigene (WT) and the linker-scanning mutations in transfected HepG2 and HEK293 cells. Total RNA was isolated at 48 h posttransfection and was subjected to reverse transcription-PCR (RT-PCR) analysis using primers specific to the transfected IR minigene mRNA. A representative gel is shown. The upper band contains exon 11 (black box), and the lower band lacks exon 11. The means and standard deviations (SD) for percentages of exon 11 inclusion (IR-B) are shown below the gel image. Results are derived from three independent experiments, and asterisks represent significant differences from the WT control level (P < 0.05.).

