FIG. 7.
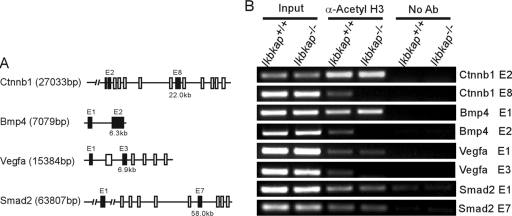
Transcriptional analysis of Ctnnb1, Bmp4, Vegfa, and Smad2 in Ikbkap+/+ and Ikbkap−/− embryos. (A) Schematic representation of the genes investigated by ChIP assay. Exons are depicted by boxes; the closed boxes indicate the localization of the amplicons. The numbers (kb) indicate the positions of these amplicons relative to the 5′ sites of genes. (B) The acetylation status of histone H3 in the transcribed regions of Ctnnb1, Bmp4, Vegfa, and Smad2 was estimated using an acetyl-histone H3 ChIP assay. Note that Ctnnb1 exon 8, Bmp4 exon 2, and Vegfa exon 3 were not pulled down with anti-acetyl-histone H3 antibody in Ikbkap−/− embryos. The genes tested, the genotypes, and the locations (E, exon) of amplicons are indicated. α-Acetyl H3, anti-acetyl-histone H3 antibody; No Ab, no antibody control.

