
Figure 2. Depletion of Coronin 1B slows retrograde actin flow, influences barbed end distribution and filament architecture at the leading edge.
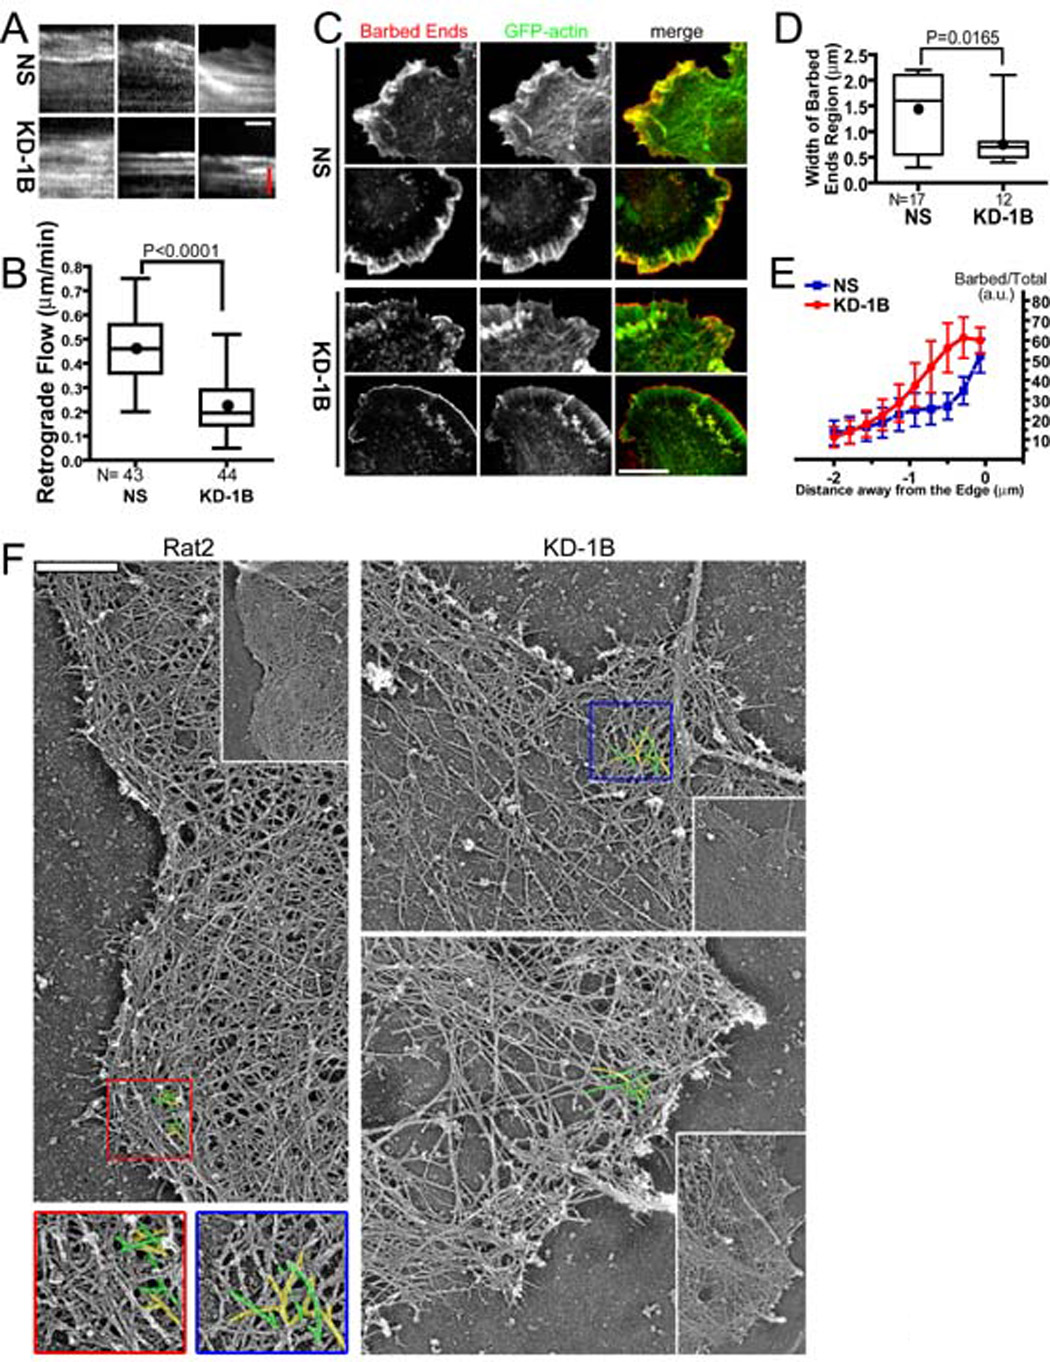
GFP-actin in Rat2 cells infected with Lentivirus expressing Coronin 1B (KD-1B) or control (NS) shRNA and GFP-actin was imaged for at 1 sec intervals for 2 min.
A- Three representative kymographs showing retrograde actin flow are presented for each condition. Red bar = 1.14 µm; white bar = 30 sec.
B- Average actin retrograde flow rate in KD-1B and NS expressing cells (3 measurements/cell, n = 40 cells) for each condition are presented as box and whisker plots (Dot = mean, middle line = median, top & bottom of box = 75% and 25%, whiskers = full data range). Unpaired student t-test indicates a signification difference between samples (P<0.0001).
C- KD-1B- and NS-expressing Rat2 cells were subjected to the barbed end assay using Alexa Fluor 568-labeled G-actin. Two cells for each condition are shown. Scale bar = 10 µm.
D- Quantification of free barbed ends in KD-1B and NS cells. Pixel intensities of Alexa-568-actin around the leading edge were plotted as described in Fig. S1. The region encompassing the top 50% of the barbed end signal is defined as the width of the barbed end zone (see Fig. S2). Width of this zone in KD-1B and NS cells is presented as a box and whisker plot. Unpaired student t test indicates a significant difference between the samples (P=0.0165).
E- The normalized ratio of barbed ends (Alexa-568 actin signal) to total actin (AlexaFluor647-phalloidin signal) was determined as a function of distance from the cell edge (see Fig. S2). Data were from cells shown in D and presented as mean with error bars indicating standard errors of the mean. Paired student t-test indicates a significant difference in barbed end density relative to F-actin between Coronin 1B-depleted and control cells (P=0.013 for the region 0.3µm - 1.4µm from the edge).
F- Platinum replica electron micrographs of lamellipodia in Coronin 1B-depleted and control Rat2 fibroblasts. Expanded views of each cell is presented as an inset. Branched actin filaments are pseudo colored with yellow and green. Scale bar = 500 nm.