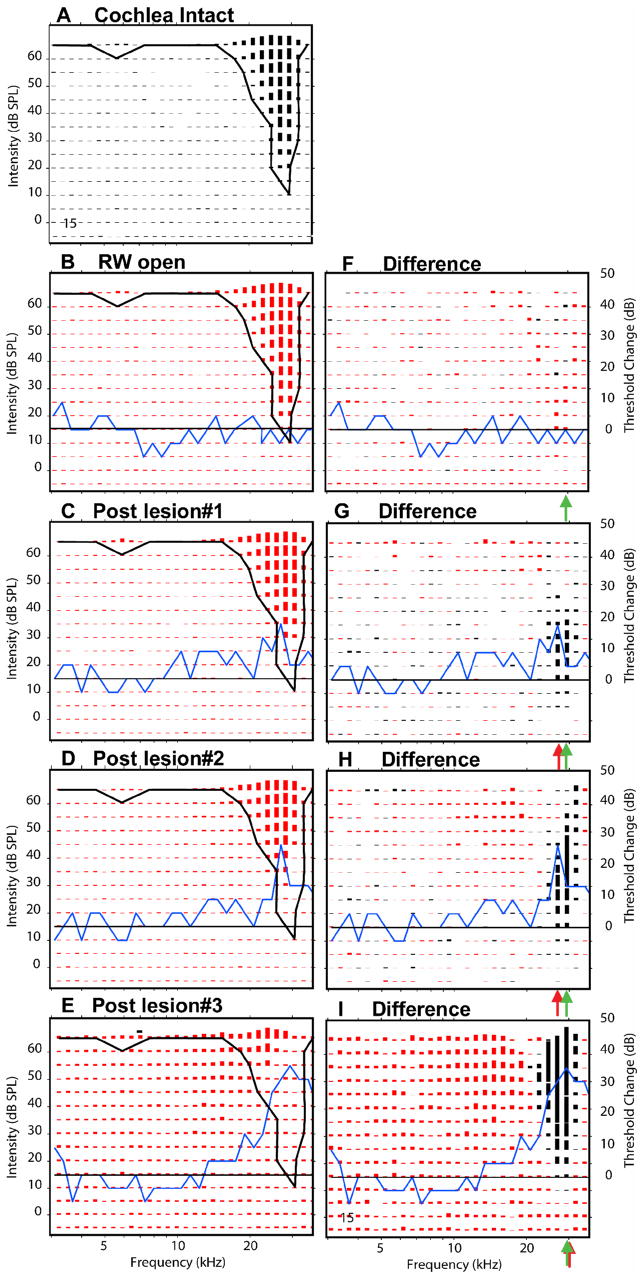
Figure 7.
Response areas recorded at one recording site in the ICC (#15, CF=28 kHz) showing the effects of three successively larger SG lesions. On the left column, panels show the response areas at 5 successive experimental stages: cochlea intact (A), after the round window has been opened (B) and then after three successively larger SG lesion responses (C–E). The black curve in each of these panels indicates the threshold tuning curve of the control responses. The blue curves indicate the changes (post-lesion minus control) in CAP thresholds at each experimental stage; the black horizontal line indicates no change in CAP threshold. Panels in the right column show the differences in response amplitude between control and post-lesion responses. Losses of excitation (round window open amplitudes > post-lesion amplitudes) are plotted in black; post-lesion gains in excitation are plotted in red. Successive horizontal pairs of panels (B–F, C–G, D–H, and E–I) represents the responses at successively experimental stages. Red arrows indicate estimates of the frequency at which the largest loss in excitation occurred. Green arrows indicate pre-lesion CF. Asterisks in the difference plots indicate frequency/level combinations where excitatory response amplitudes were unaffected by the lesion.

