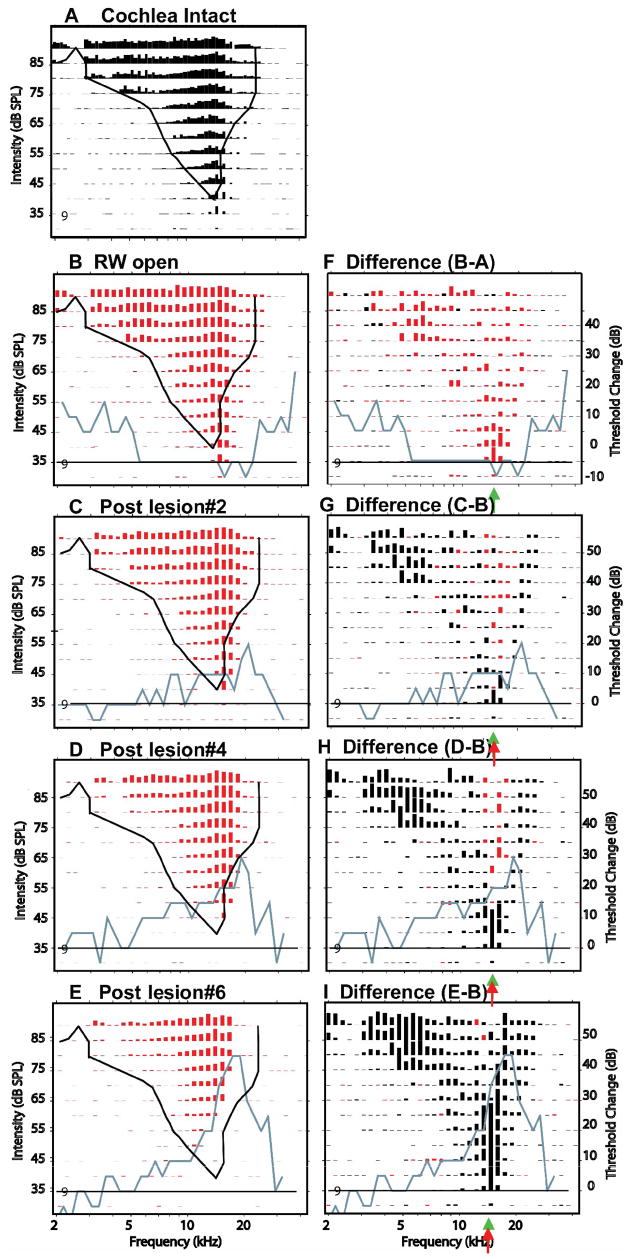
Figure 9.
Effects of 3 successively larger SG-lesions at a site #9 located at 800 mm from the most superficial site. CF & BF = 14.7 kHz. The left column of panels show response areas at 5 successive experimental stages: cochlea intact (A), after the round window has been opened (B) and then after three successively larger SG-lesions (C–E). Black curve in each panel is the threshold tuning curve of responses in the intact cochlea. Blue curves plot CAP thresholds changes (post-lesion minus control) at each experimental stage; Black horizontal line plots the no-change contour in CAP threshold. The right column of panels shows the differences in response amplitudes between control (B) and post-lesion responses at each stage. Post-lesion excitatory losses (round window open amplitudes > post-lesion amplitudes) are plotted in black; post-lesion excitatory gains are plotted in red. Red arrows indicate estimates of the frequency at which the largest loss in excitation occurred. Green arrows indicate pre-lesion CF. Black slanted arrows indicate excitatory losses in low frequency response “tails” at frequencies remote from the lesion frequencies.

