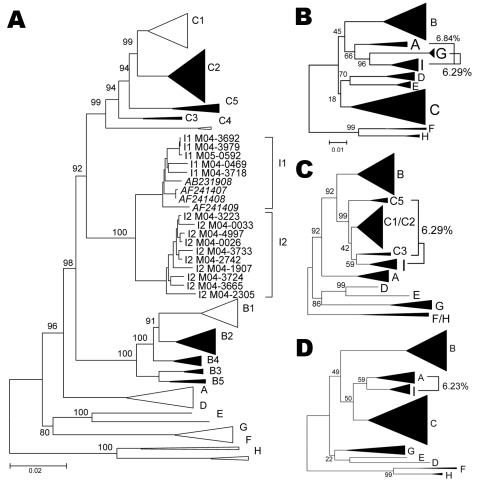
Figure 1.
A) Phylogenetic comparison of all complete genotype I genomes (n = 15) obtained and compared to sequences of all known genotypes and subgenotypes. Non–genotype I genotypes identified in Lao People’s Democratic Republic in the present study are shown as full triangles. Numbers indicate bootstrap values of important nodes. B–D) Phylogenetic comparison of positions 400–1400 (left), 1400–3000 (middle), and 3000–400 (right), of all genotype I strains with all known genotypes and subgenotypes. Percentages indicate average genetic distances between genotype I and G, C, or A, respectively. Scale bars indicate number of substitutions per site.

