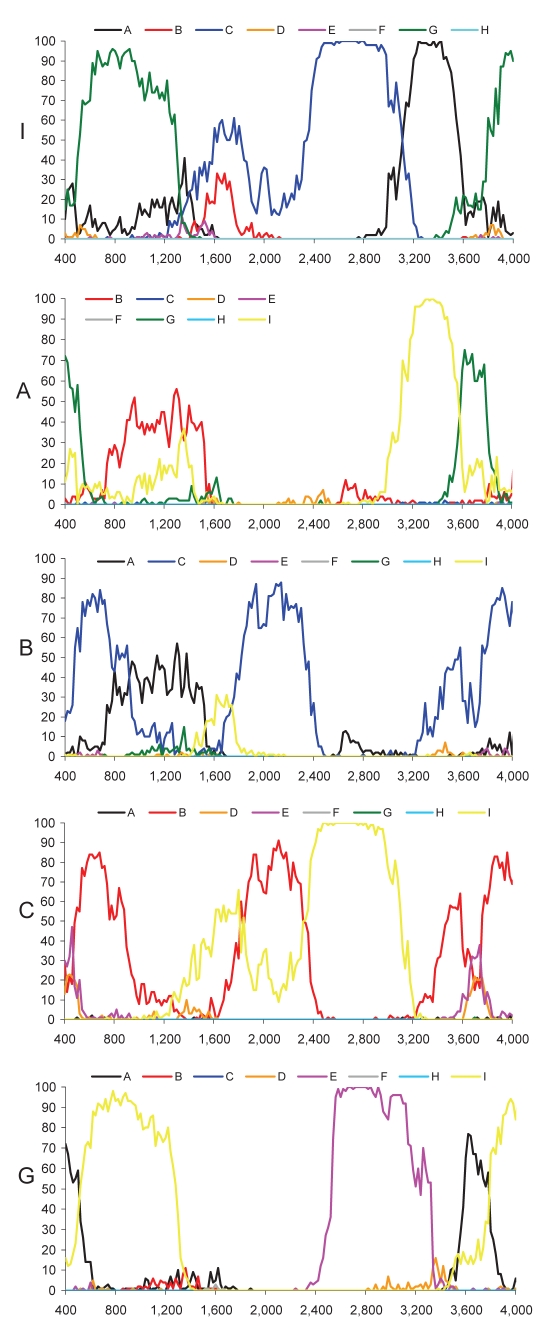
Figure 2.
Bootscan analysis of genotypes I, A, B, C, and G compared with genotypes A–H. Data points correspond to the center of sequence windows of 800 bp. For the analysis of the first 400 nt, the beginning of the genome was duplicated at the end of the sequence: nt 3200–4000 represent positions 0–800.

