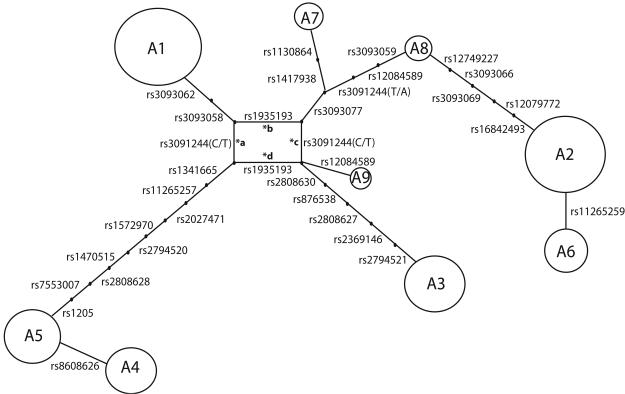
Figure 2.
Cladogram demonstrating a phylogenetic relationship between African American haplotypes. Each haplotype is represented by a circle whose size is roughly proportional to the population frequency. Connecting lines are annotated by the SNPs which distinguish one haplotype from another. Small dots along these lines represent haplotypes which are no longer observed but can be inferred to have existed in the population history. The loop at the centre of the tree represents uncertainty over the clade structure. Either rs3091244 (C/T) or rs1935193 may be the first mutational event, and consequently either rs3091244 (C/T) or rs1935193 must have mutated twice, from the wild type to the new allele, and then back to the wild type. These four explanations may be envisaged by removing either of the four branches labelled *a, *b, *c or *d.

