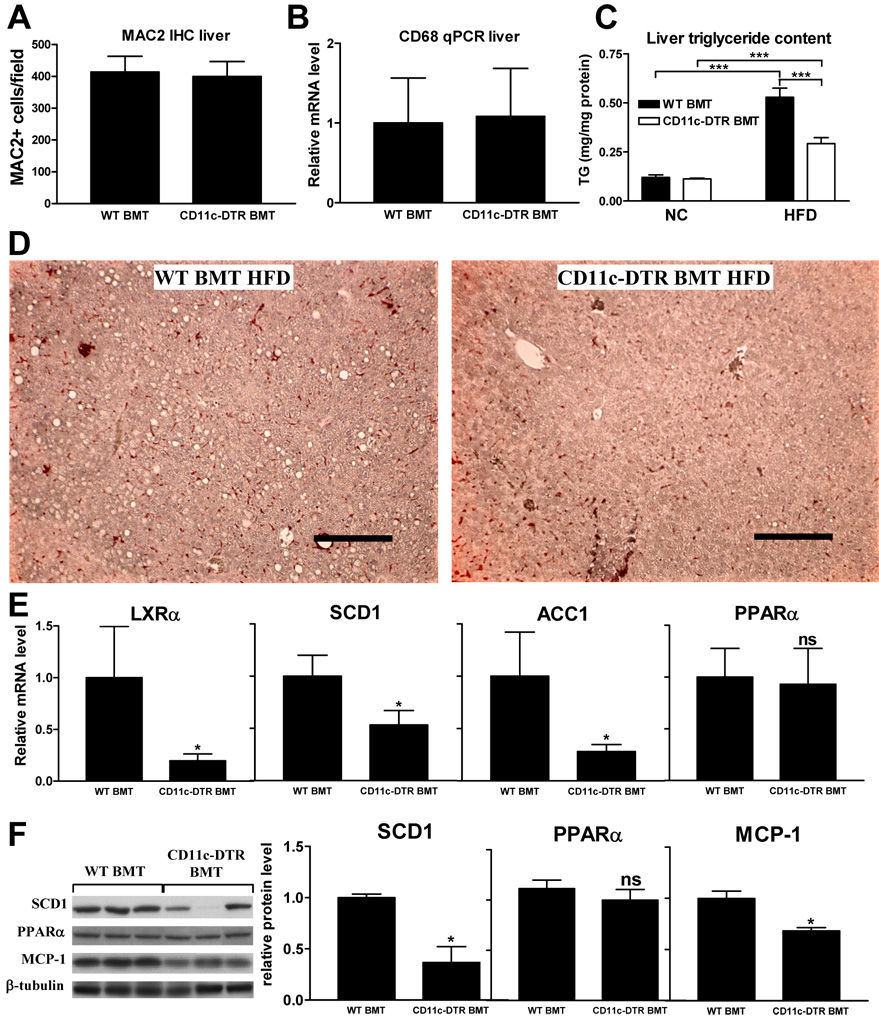
Figure 4. Liver data.
Liver macrophage content as measured by quantification of a) MAC2 immunohistochemistry and b) relative mRNA levels of the macrophage marker CD68. c) Liver triglyceride content as measured in liver lysates and d) as illustrated by presence of clear lipid droplets in MAC2-stained liver tissue sections. Scale bar represents 250 µm. e) Relative liver mRNA levels of liver X receptor alpha (LXRα), stearoyl CoA desaturase-1 (SCD1), acetyl-CoA carboxylase 1 (ACC1), and peroxisome proliferator-activated receptor (PPAR) α. f) Western blots for SCD1, PPARα, MCP-1 and β-tubulin showing relative protein levels normalized to β-tubulin. All data shown in this figure were combined from 4 groups of mice that were treated with DT for a period of 3, 5, 9, or 17 days. Data are expressed as mean ± SEM. *P<0.05 compared to WT BMT. ***P<0.001. n ≥ 15 per group. ns means not significant.

