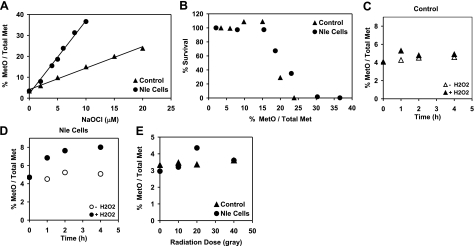
Figure 6.
MetO content, shown as the percentage of the sum of Met + MetO. A) MetO content in hypochlorite-exposed cells. B) Cell viability as a function of MetO content in hypochlorite-exposed cells (from A and Fig. 4A). C, D) MetO content in control cells (C) and cells exposed to hydrogen peroxide (D). E) MetO content in irradiated cells.

