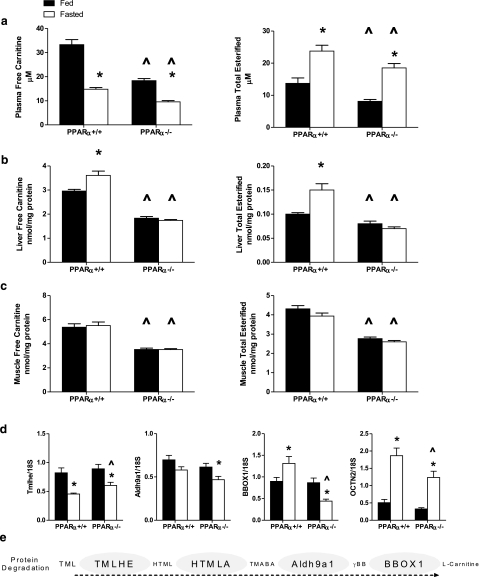
Figure 2.
Carnitine metabolism in PPARα+/+ and PPARα−/− mice. a–c) Free carnitine and total carnitine esters were measured in plasma (a), liver (b), and gastrocnemius muscle (c) harvested in the ad libitum-fed or 18-h-fasted state from PPARα+/+ (n=8 fed, n=8 fasted) and PPARα−/− (n=10 fed, n=10 fasted) mice. d) Expression of genes involved in liver carnitine metabolism was determined by qRT-PCR: trimethyllysine hydroxylase, epsilon (TMLHE), aldehyde dehydrogenase 9 family, member A1 (Aldh9a1), gamma-butyrobetaine hydroxylase 1 (BBOX1), and carnitine/organic cation transporter (OCTN2). Data are presented as means ± se. Main effects of starvation and genotype were detected by two-way ANOVA or Student’s t test; *P < 0.05 vs. fed state, ^P < 0.05 vs. PPARα+/+ genotype. e) Pathway of carnitine biosynthesis: protein degradation generates 6-N-trimethyllysine (TML), which is hydroxylated by TMLHE to form 3-hydroxy-6-N-trimethyllysine (HTML). HTML-aldolase (HTMLA) produces 4-trimethylaminobutyraldehyde (TMABA), which is then oxidized to gamma-butyrobetaine (γBB) by Aldh9a1. Finally, BBOX1 hydroxylates γ-BB to form l-carnitine.

