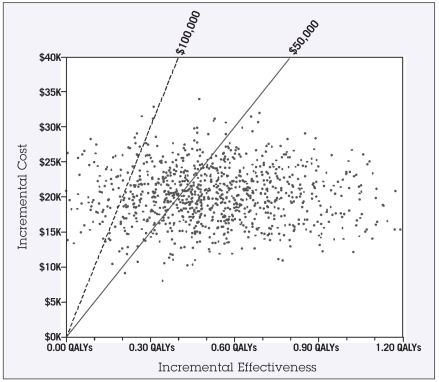
Figure 2.
Scatter plot showing results of Monte Carlo probabilistic sensitivity analysis. Each point represents the outcome of 1,000 simulated trials in which each input was assigned a random value according to its probability density function. The solid and dashed diagonal lines indicate the $50,000 and $100,000 thresholds, respectively. The percentage of points that fall to the right of these lines (67% and 91%) indicate the likelihood that this intervention would be cost-effective at that threshold level.
Abbreviation: QALY = quality-adjusted life-year.

