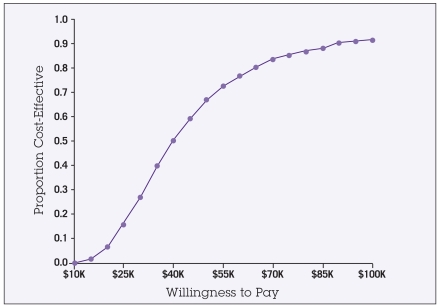
Figure 3.
Acceptability curve depicts the likelihood that the intervention would be interpreted as cost-effective at any given societal threshold level (“willingness to pay”). For example, the model predicts a 67% probability that the incremental cost-effectiveness of this intervention would be < $50,000 per QALY (quality-adjusted life-year), and a 91% probability that this intervention would be < $100,000 per QALY.

