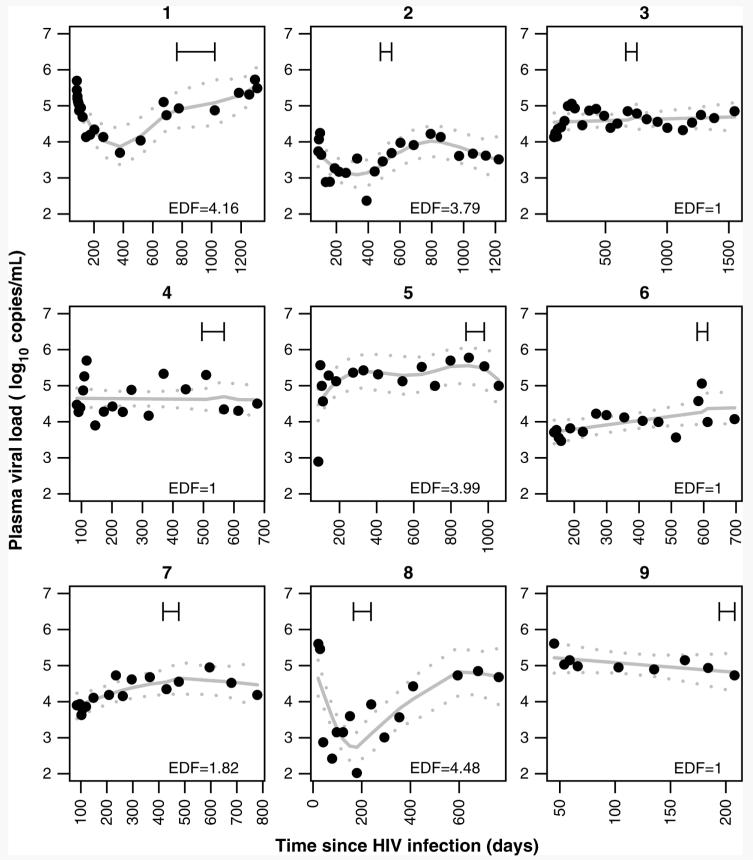
FIGURE 1.
Longitudinal plots describing HIV viral dynamics of 9 individuals who acquired HSV-2 infection. The intervals represent the calculated interval of time during which individuals could have acquired HSV-2 infection. The first point of the CI represents the date 2 weeks before the last negative HSV-2 EIA result so as to account for the potential seroconversion window time of HSV-2 EIA. The second point represents the date of the first positive HSV-2 EIA result. Note that the subject in panel 6 is the man who had a transient finding. The solid lines represent the fit of a generalized additive model, in which a nonparametric smooth was fitted to each individual, including a covariate indicating the first time point at which the individual was HSV-2–seropositive. Dotted lines represent 95% CIs. EDF for each curve are indicated, with higher values of EDF corresponding to more nonlinear curves.

