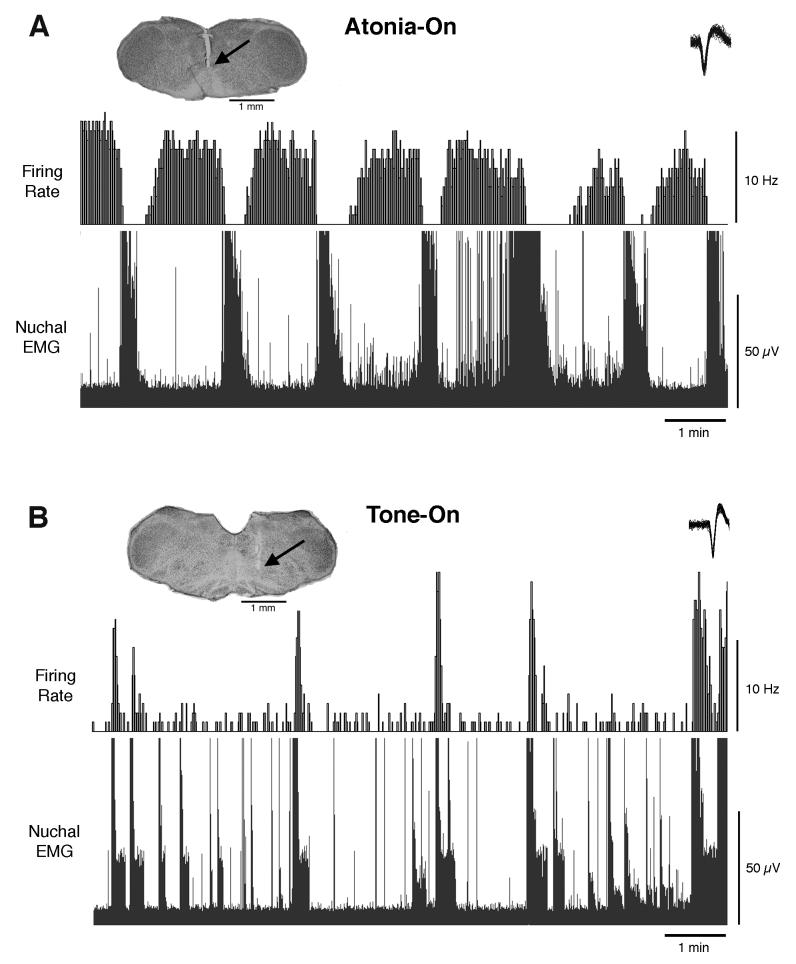
Figure 3.
State-dependent unit discharges in the ventromedial medulla of P7-10 rats. The discharge profile of (A) a representative atonia-on unit and (B) a representative tone-on unit are presented above their associated nuchal EMG traces. Within each photomicrograph, the arrow indicates the tip of the electrode. The inset in each of the upper-right corners depicts 50 superimposed action potentials of the sorted unit. For purposes of illustration, the EMG traces are full-wave rectified.

