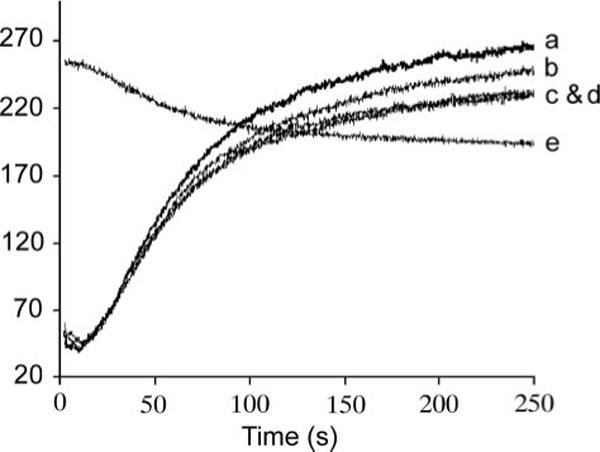
FIGURE 2.

a−d, light scattering was used to compare the assembly of 10 μm MtbFtsZ before and after labeling with fluorophores. a, unlabeled; b, fluorescein-labeled; c, TMR-labeled; d, a mixture of 5 μm MtbFtsZ-fluorescein and 5 μm MtbFtsZ-TMR. Curve e shows this mixture assayed for assembly by FRET. Light-scattering assays were excited and detected at 350 nm; the FRET assay was excited at 450 nm and detected at 515 nm (assembly is measured by the decrease in donor emission at 515 nm). The FRET signal was normalized to the light-scattering signal. Both light-scattering and fluorescence measurement started immediately after adding GTP.
