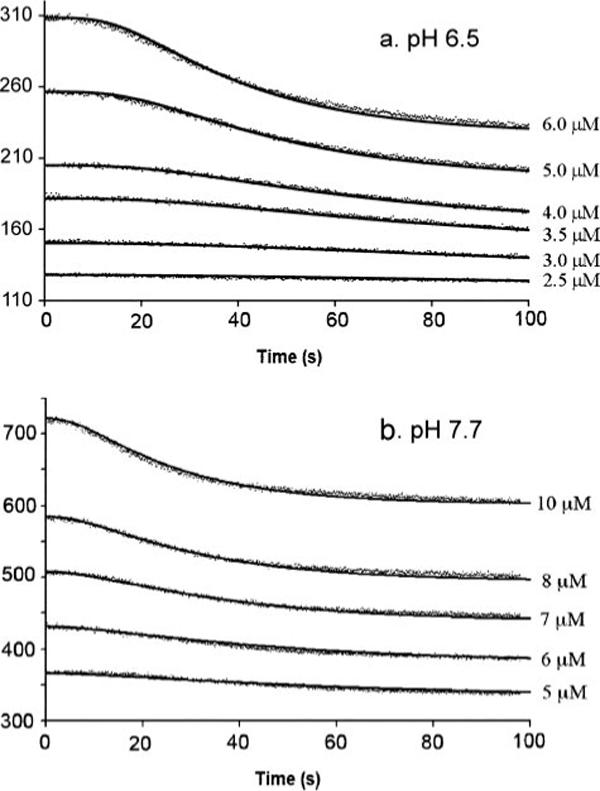
FIGURE 4. Assembly kinetics and fitting results at different concentrations of MtbFtsZ in MMK buffer (a) and HMK buffer (b).

The measured donor fluorescence is represented by closely spaced dots. A solid line through each set of data is the computer fit based on the nucleation model. The values of the kinetic parameters giving the best fit are shown in Table 2.
