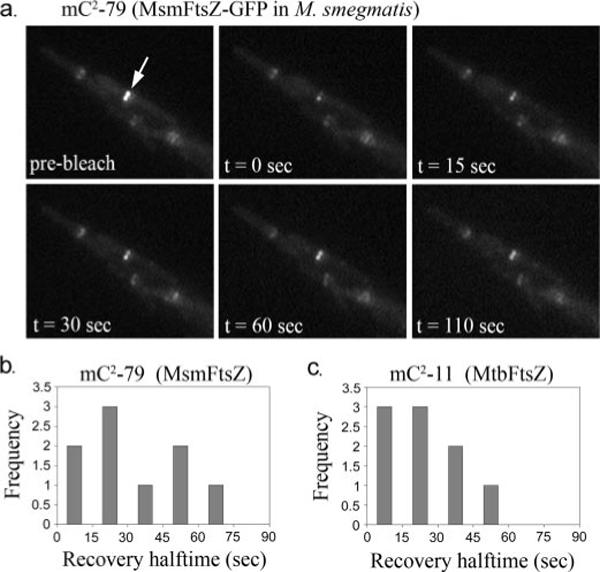
FIGURE 6. In vivo FRAP of MsmFtsZ and MtbFtsZ Z-rings in M. smegmatis.

a, representative FRAP time series for strain mC2-79 (expressing MsmFtsZ-GFP). The white arrow indicates the half of the ring about to be bleached. b, histogram of FRAP recovery half-times obtained for MsmFtsZ-GFP in M. smegmatis. c, histogram of FRAP recovery times for MtbFtsZ-GFP in M. smegmatis.
