
Figure 2.
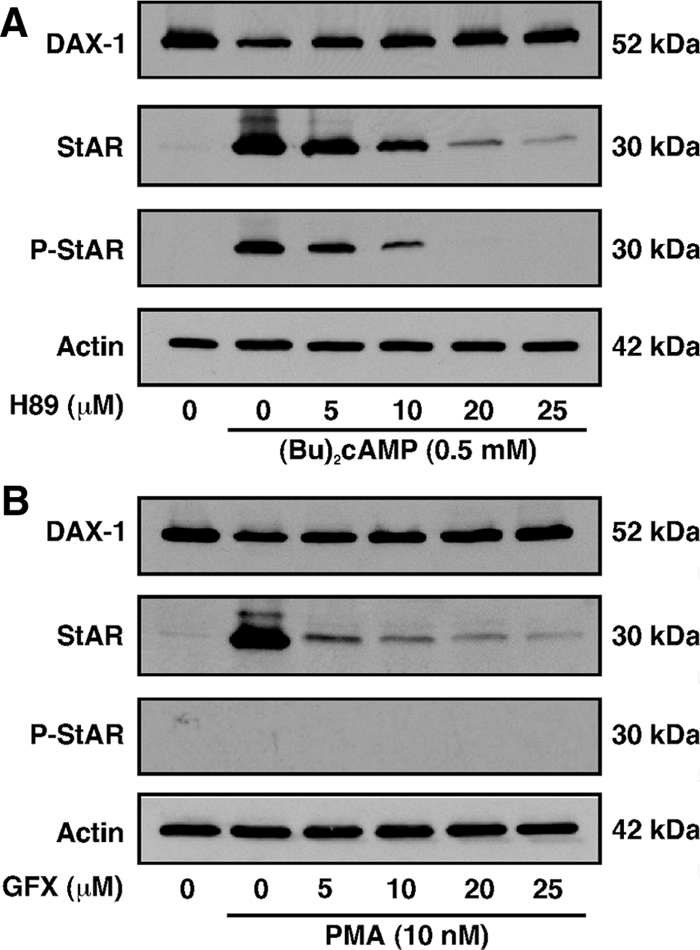
Inhibition of PKA and PKC signaling on DAX-1, StAR, and P-StAR levels in MA-10 cells. Cells were pretreated with increasing doses PKA (H89; 0–25 μm) and PKC (GFX; 0–25 μm) inhibitors for 30 min and then incubated without or with (Bu)2cAMP (0.5 mm; A) and PMA (10 nm; B) for an additional 6 h. Actin expression was assessed as a loading control (A and B). Representative immunoblots illustrate expression of DAX-1, StAR, and P-StAR using 25–30 μg of total protein. Data are representative of three independent experiments.