
Figure 3.
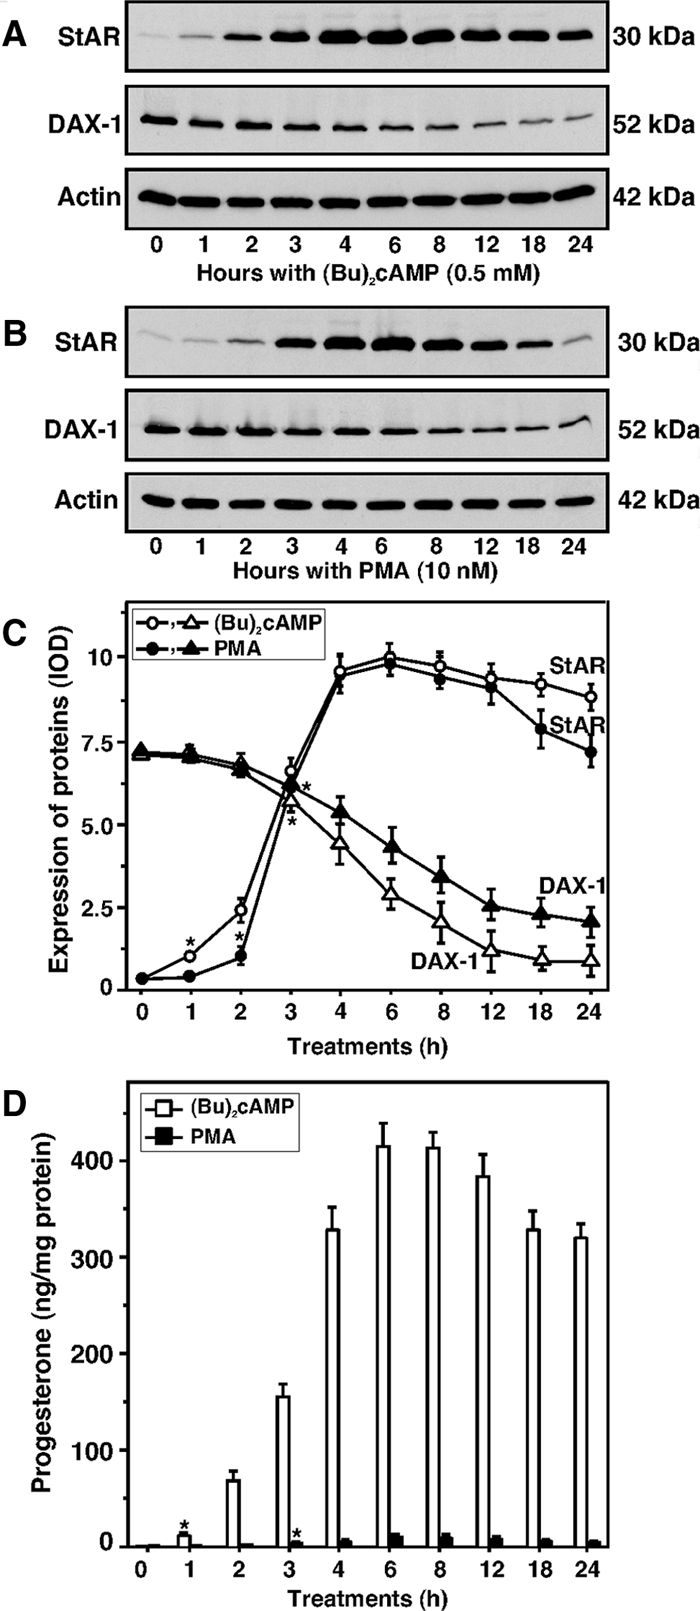
Time-course expression patterns of StAR and DAX-1 proteins and progesterone synthesis in response to (Bu)2cAMP (0.5 mm) and PMA (10 nm). MA-10 cells were treated for 0–24 h at the indicated doses of (Bu)2cAMP (A) and PMA (B), and 22–25 μg of total protein were used for Western blot analyses. Representative immunoblots illustrate the expression of StAR and DAX-1 in different treatment groups. Integrated OD (IOD) values for each band were quantified and compiled data from three independent experiments for both proteins are presented (C). Actin expression was assessed as a loading control. Accumulation of progesterone in the media of the same treatment groups was determined and expressed as nanograms per milligram protein, which represent the mean ± se of three independent experiments (D). Asterisks indicate the first time point at which values were significantly different (P < 0.05) from controls.