Figure 4.

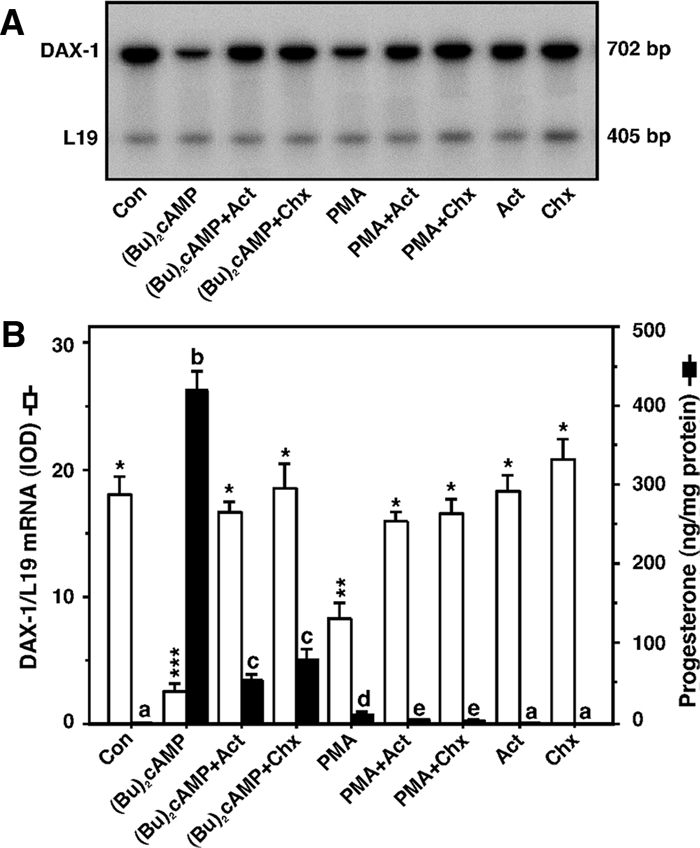
Inhibition of DAX-1 expression by PKA and PKC signaling requires transcription and de novo protein synthesis. MA-10 cells were treated without (Con) or with (Bu)2cAMP (0.5 mm) and PMA (10 nm) in the absence or presence of Act (5 μm) and Chx (5 μm) for 6 h and subjected to DAX-1 mRNA expression by RT-PCR analysis (A). A representative autoradiogram illustrates the expression of DAX-1 and L19 in different treatment groups using 2 μg of total RNA. Integrated OD (IOD) values of each band were quantified and normalized to the corresponding L19 bands (B). Accumulation of progesterone in the media was determined and expressed as nanograms per milligram protein (B). Results represent the mean ± se of three independent experiments. Note the different scales on the graph. Letters above the bars indicate that these groups differ significantly from each other at least at P < 0.05. *, P < 0.05; **, P < 0.01; ***, P < 0.001 vs. control DAX-1 mRNA.
