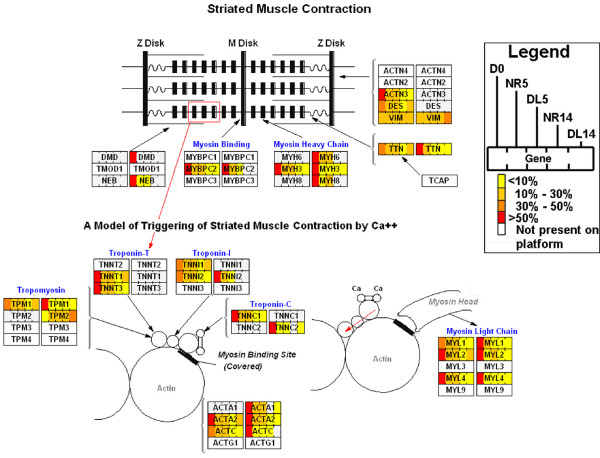
Figure 4.
Schematic of down-regulated muscle contraction genes. Striated muscle contraction genes that were downregulated during limb regeneration. Each gene is represented by two boxes that denote proportional expression among Day 0, NR5, DL5, NR14, and DL14 samples. The left box reports hybridization intensity from the microarray experiment and the right box reports normalized count data from the 454 cDNA sequencing experiment. Figure 4 was modified from a MAPP originally created by Joanna Fong and Nathan Salomonis.

