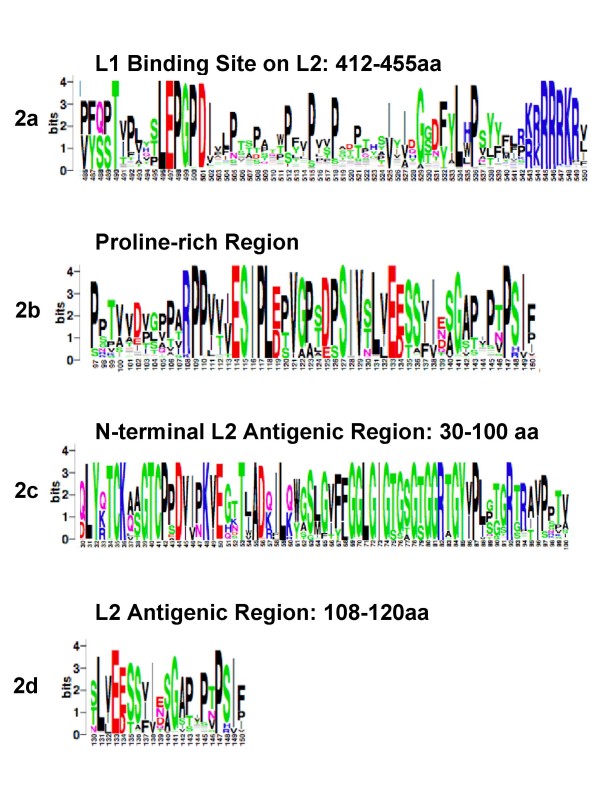
Figure 2.
Analysis of conserved regions within the L2protein. Similar to the L1 analysis, L2 protein sequences derived from NCBI and ICTV databases were aligned using MUSCLE and visualized with CLUSTALX interface for graphical representation of residue conservation and analysis. Sequence conservation is by the height of residue logos (indicated in bits), as generated by WebLogo 3. The known L1 interaction domain of L2 (486–550 aa in the alignment, corresponding to 412–455 aa in HPV16 L2) (2a), conserved proline rich regions (2b), well conserved N-terminal antigenic regions (30–100 aa) (2c), and (aa 108–120) (2d) are shown. The C-terminal DNA binding domain, rich in lysines, from HPV 16 AA 500–531, is highly conserved for alpha HPVs.

