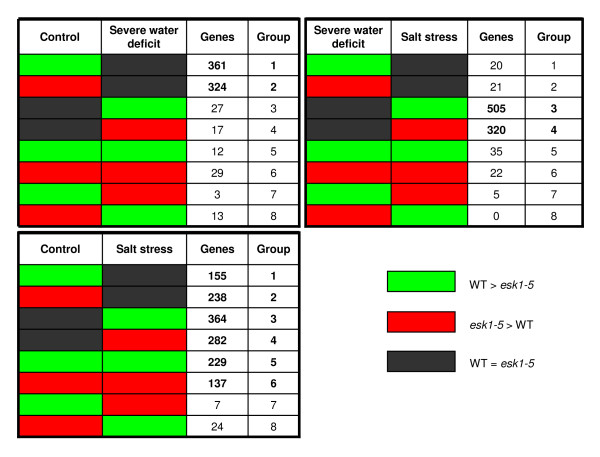
Figure 13.
Differential gene expression between esk1-5 and wild type. The green cells represent genes that were over-expressed in the Col-0 line (and under-expressed in the esk1-5 mutant line). The red cells represent genes that were over-expressed in the esk1-5 mutant line (and under-expressed in the Col-0 line). The black cells represent genes that were not differentially expressed between the Col-0 and the esk1-5 mutant line. The third column in each table shows the number of genes in each group (fourth column). Top-left table: comparison between the control and the water deficit conditions. Bottom-left table: comparison between the control and the salt stress conditions. Top-right table: comparison between the water deficit and the salt stress conditions.

