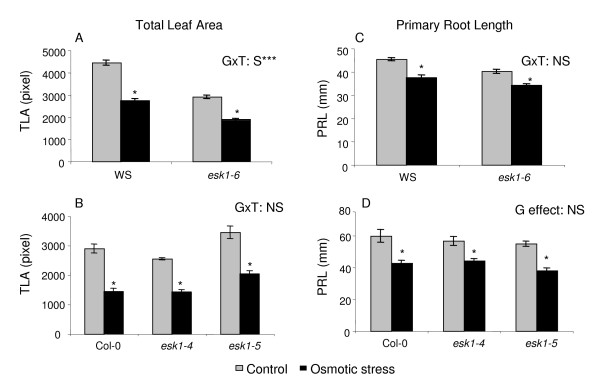
Figure 4.
Response to osmotic stress by esk1 mutant lines and wild type. Graphs show the Total Leaf Area (TLA in pixels) and Primary Root Length (PRL in mm) of the esk1-6 homozygous mutant line and WS wild type (A and C) and of esk1-4 and esk1-5 homozygous mutant lines and Col-0 wild type (B and D) on control media or media supplemented with 60 mM (A and C) or 75 mM (B and D) mannitol. * indicates that a significant treatment effect was observed on all the traits measured. GxT: S*** indicates that there was a significant genotype × treatment interaction with a p-value < 0.001. GxT: NS indicates that there was no significant genotype × treatment interaction. G effect: NS indicates that there was no significant genotype effect in control and in stress conditions. Error bars are standard errors.

