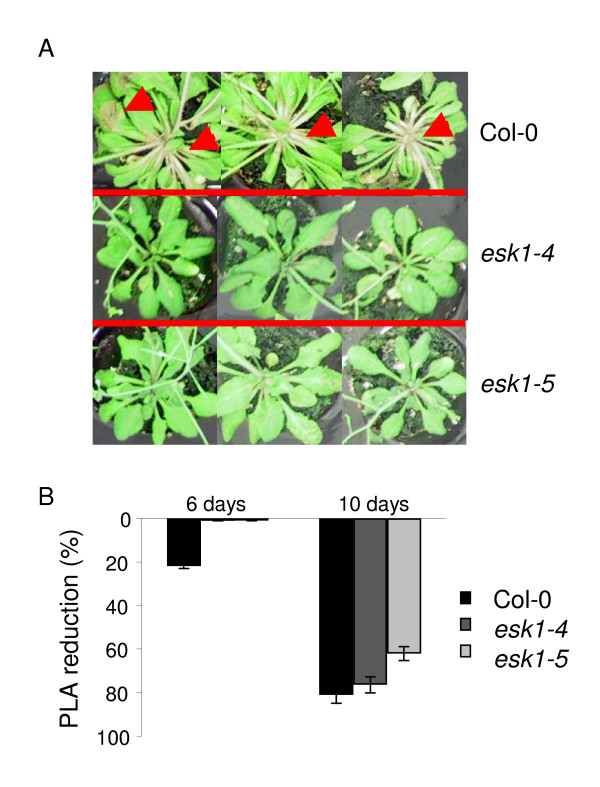
Figure 6.
Response to salt stress by esk1 mutant lines and wild type. The photo shows three Col-0 (1st line), esk1-4 (2d line) and esk1-5 (3rd line) plants after soaking for 24 hours in concentrated nutritive solution. Red arrows indicate areas where photosynthetic tissues are being lost. The graph shows the % of PLA reduction for the mutant lines esk1-4 (grey bars) and esk1-5 (light grey bars) and Col-0 (black bars) after 6 (three bars on the left) and 10 days (three bars on the right) of salt stress as described in the Material and Methods. Error bars show the 95% confidence interval.

