
Figure 8.
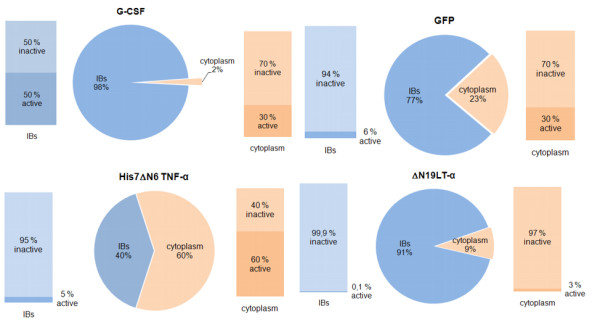
Distribution of target protein between the soluble fraction (cytoplasm) and insoluble fraction (IBs) is presented on pie diagrams. Percentages of specific biological activity of target proteins in each fraction are presented on column charts.