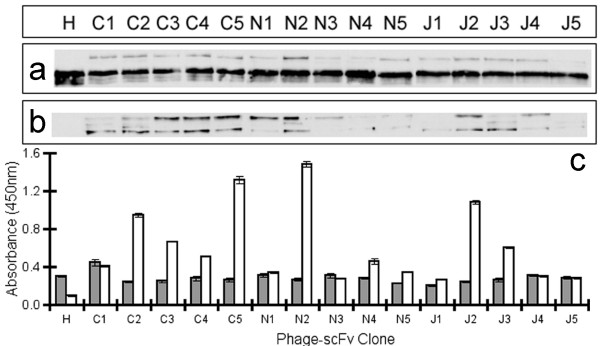
Figure 1.
Analysis of scFv phage display propensity. Each of the 15 scFv-phage clones and helper phage were produced in E. coli (XL1-Blue), equalised, electrophoresed by SDS-PAGE, blotted and probed with (a) anti-pIII antibody to demonstrate equalised phage titre or (b) anti-his6 antibody to detect varying levels in display of scFv on phage, as described above. The absolute chemiluminescent signals were measured by densitometry. (c) Binding to undiluted phage coated onto an immunosorbent plate was measured by ELISA to determine levels of pIII and his6 using the same antibodies above. ELISA error bars represent standard error from triplicate measurements. Grey bars represent mean anti-pIII signal and white are mean anti-his signal. A representative data set is shown from one batch of each phage-scFv for both the western blot and ELISA methods. Three independently produced batches of phage were analysed.

