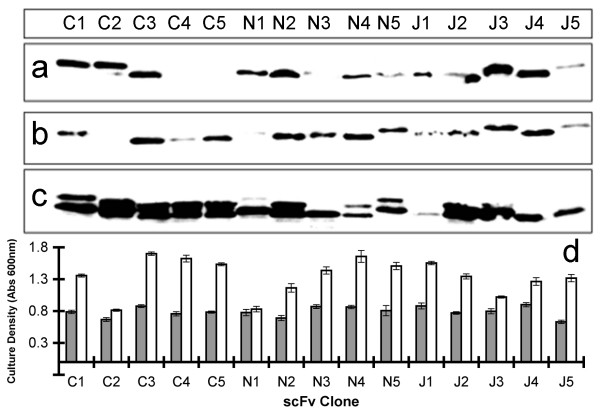
Figure 2.
Compartmental analysis of overall relative levels of scFv expression in Escherichia coli. Each of the 15 scFv clones were produced in E. coli (HB2151). The cultures were equalised for bacterial density and the supernatant, periplasmic and spheroplast fractions were electrophoresed by SDS-PAGE and blotted. Anti-his6 antibody was used to probe for the scFvs, developed by chemiluminescence. (a) supernatant fraction, (b) periplasmic fraction and (c) spheroplast E. coli pellet. The blot is representative of three independent experiments conducted on independently produced samples. (d) Pre-induction (grey bars) and final culture densities (white bars) measured by OD600 are also shown and represent mean values from three independent experiments.

