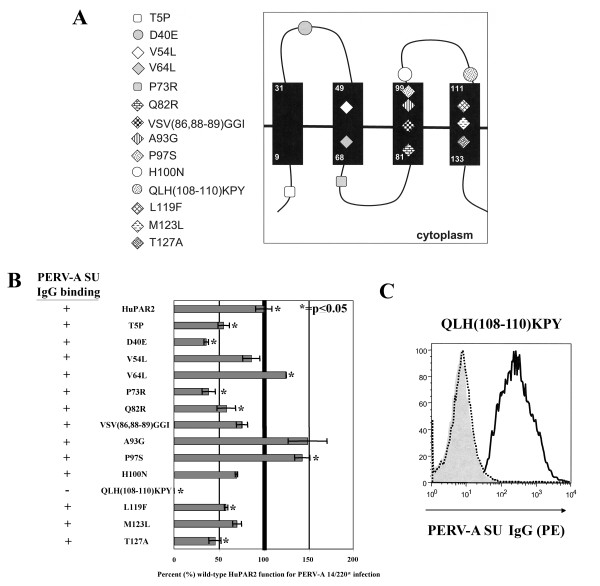
Figure 4.
Single residue and mini-region mapping of the eighteen amino acid differences in the critical N-terminal region of HuPAR2 for binding and infection. (A) shows the location of the residue differences in HuPAR2 based on the current topology model. Mutations were introduced in the HuPAR2eGFP fusion protein and were expressed in non-permissive SIRC cells. Stably selected and eGFP sorted SIRC/HuPAR2 populations were assayed for PERV-A binding and infection by a FACS-based PERV-A SU IgG binding assay and a PERV pol qPCR-based infection assay. PERV pol copy numbers were normalized to wild-type HuPAR2 and expressed as percent (%) of wild-type (WT) HuPAR2 function. (B) shows the results from both the binding and infection assays (average of three replicates). Eight mutations significantly decreased HuPAR2 function for PERV-A infection (p ≥ 0.05). Only one mutation, QLH(108–110)KPY, completely prevented PERV-A binding. (C) shows the FACS histogram from the binding assay. The PE fluorescence shift seen for wild-type HuPAR2 (solid black line) is not seen for QLH(108–110)KPY (dotted black line), which is identical to the SIRC cells not expressing a receptor (solid gray graph).

