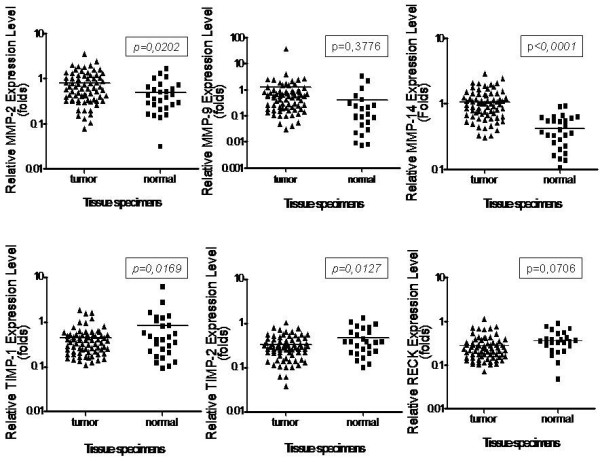
Figure 3.

Expression levels of MMPs and their inhibitors by qRT-PCR. It was performed using total RNA from samples of primary breast tumors and adjacent normal border. β-actin was used to normalize the values. The statistical significance was determined using Student's t test.
