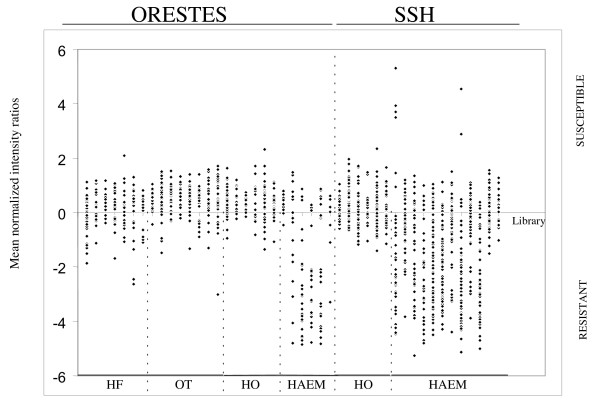
Figure 3.
Scatter plot of mean (across the 4 replicate arrays) fold difference in expression, based on normalized mean intensity ratios across each sequenced library, demonstrating the origin (tissue and method) of the differentially expressed genes. ORESTES – open reading frame EST libraries, SSH – suppression subtractive hybridization libraries. OT – ovotestis, HAEM – haemocytes, HO – haemopoietic organ, HF – headfoot.

