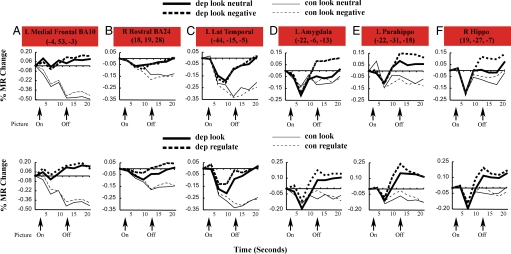
Fig. 2.
Time–activity curves are shown for a subset of regions in Fig. 1. (A–F) Time–activity curves plot percent fMRI signal change (y axis) vs. time in seconds (x axis). Regions compare passive viewing of negative pictures to passive viewing of neutral pictures (look) (Upper), compare passive viewing of negative pictures to regulation of emotion (regulate), and time within trial that reflected modulations of task-related activation (Lower). (A–C) As indicated, there was less of a decrease in activity in depressed compared with control subjects in left ventromedial prefrontal cortex (BA10) (A), right rostral anterior cingulate (B), and left lateral temporal cortex (C). (D–F) There was a greater increase in depressed subjects in the look condition (Upper) for the left amygdala (D), left parahippocampus (E), and right hippocampus (F). The greater activity during the regulate condition (Lower) was only significant in the L parahippocampus. The regulate condition difference (Lower) was only significant in the left parahippocampus.

