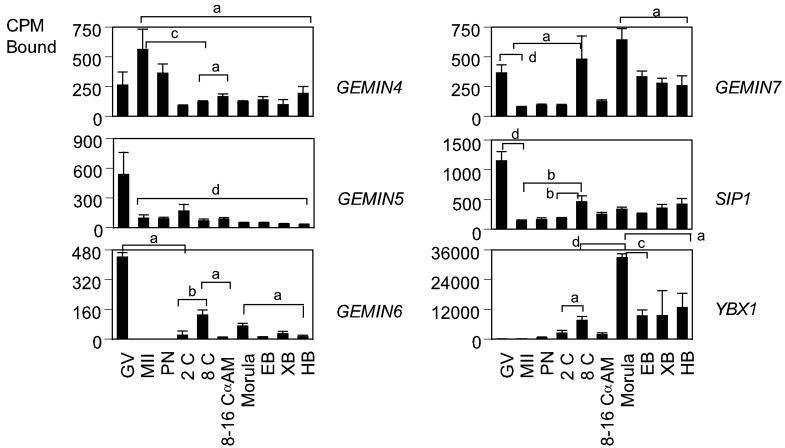
Figure 2.
Temporal expression patterns of mRNAs encoding proteins involved in RNA splicing in rhesus monkey oocytes and embryos. Graphs show the relative levels of expression for GV and MII stage oocytes and pronucleate through hatched blastocyst stage embryos produced by in vitro fertilization of oocytes from hCG-stimulated females, and then cultured in vitro in HECM9. GV, germinal vesicle stage oocyte; MII, MII-stage oocyte; PN, pronucleate 1-cell stage embryo; 2C, 2-cell stage embryo; 8C, 8-cell stage embryo; 8–16C αAm, 8- to 16-cell stage cultured in α-amanitin; EB, early blastocyst; XB, expanded blastocyst; HB, hatched blastocyst. Expression data for the mRNAs encoding the indicated proteins are expressed as the mean CPM bound, and the standard error of mean (SEM) is indicated. Statistically significant differences in gene expression corresponding to some of the major increases or decreases in expression are denoted by the brackets (for comparisons between stages at the ends of the brackets). Letters a through d indicate P < 0.05, 0.01, 0.001, and 0.0001, respectively.

