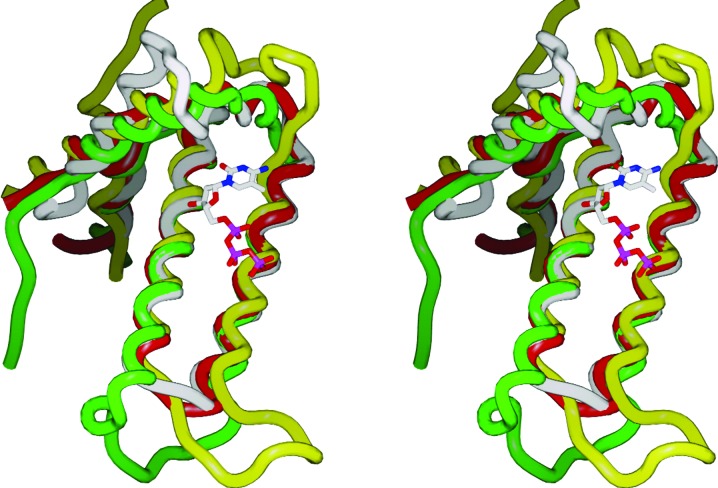
Figure 3.
Superposition of the backbones of Mtb HisE (PDB code 1w2y; white), S. solfataricus MazG (1vmg; red), mouse RS21-C6 MazG homolog (2oig; green) and T. cruzi dUTPase (1w2y; yellow; residues 110–229 deleted for clarity). The figure illustrates the high variability of the backbone in the loop region connecting helices H1 and H3 (residues 24–37 in Mtb HisE, including helix H2), in contrast to the good alignment of the central helix pair H3 and H4. Also shown is the 5-methyl-dCTP that was complexed with 2oig, indicating the putative substrate-binding region.

