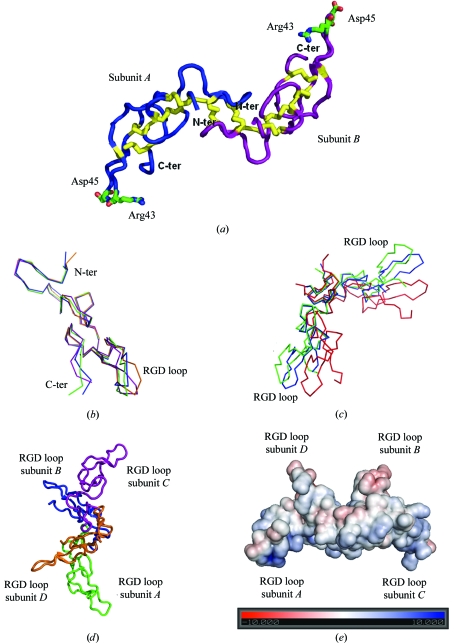
Figure 2.
(a) Overall structure of the acostatin heterodimer represented by a Cα tracing of subunits A (in blue) and B (in magenta) with disulfide bridges in yellow and the side chains of the RGD binding loops. (b) Superimposition of the Cα tracing of the acostatin ABCD subunits (A subunit in green, B in blue, C in purple and D in orange). (c) Superimposition of the Cα tracing of acostatin AB (green) and CD (blue) dimers on the dimer from E. carinatus (red). (d) Overall structure of the tetrameric arrangement of all acostatin subunits represented by a Cα tracing. (e) The electrostatic surface of the acostatin tetramer on the scale ±10 kT/e. The color map is from red (negative electrostatic potential) to blue (positive electrostatic potential). The figure was prepared in PyMOL (DeLano, 2002 ▶) and the electrostatic potential was calculated using APBS (Baker et al., 2001 ▶).

