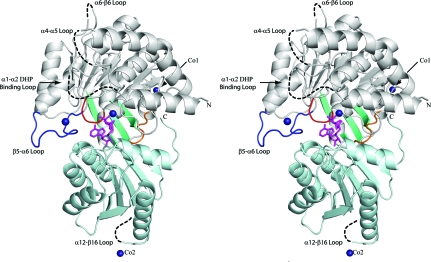
Figure 2.
Ribbon diagram of MtFPGS in stereoview. The N-domain is shown in grey and the C-domain is shown in light cyan. The P-loop is shown in red, the β5–α6 loop in dark blue and the interdomain-connecting peptide in orange. Dashed lines represent sections of the polypeptide chain lacking electron density, including the disordered DHP-binding loop (α1–α2) and several other mobile loops. The small three-stranded β-sheet is shown in teal and the bound ADP is shown in magenta in stick mode. Co atoms are shown as dark blue spheres, with Co1 and Co2 showing the location of the cobalt ions involved in crystal contacts.

