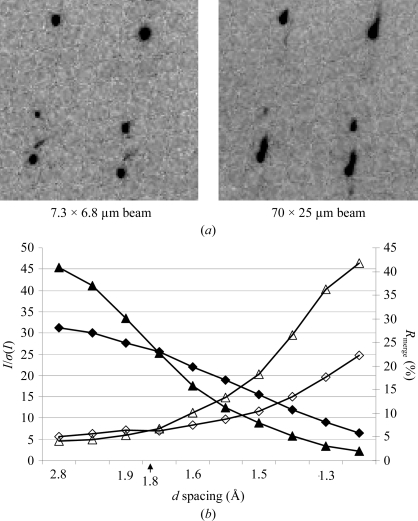
Figure 6.
Effect of beam size on data from a large inhomogeneous lysozyme crystal. (a) Identical region of reciprocal space imaged with the mini-beam (left) and with the large beam (right). (b) Comparison of data measured with the mini-beam (triangles) and a large beam (diamonds). I/σ(I) (solid symbols) and R merge (open symbols) are plotted. Data from the mini-beam within a 1.8 Å limit are of higher quality, whereas beyond 1.8 Å the quality of the large-beam data is superior.

