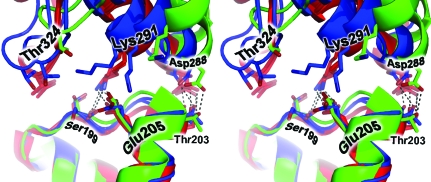
Figure 4.
A stereoview of some of the conserved atomic interactions in the longitudinal actin interface. Interfaces from the six independent crystal structures are shown. Shown in red are three structures (models A, B and D) that group together in the lower left quadrant of the principal component analysis plot (Fig. 2 ▶ c). Shown in blue are two structures (C and E) that fall in the lower right quadrant of the principal component analysis plot. Shown in green is the single crystal structure (F) that appears in the upper right quadrant of the principal component analysis plot. Highlighted interactions include the frequently observed hydrogen bond between Thr203 and Asp288.

