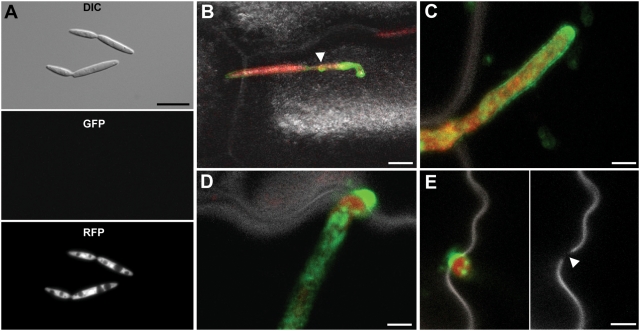
Figure 4. Expression and secretion of Pep1.
A: Haploid sporidia of strain SG200pep1:gfpR grown in YEPSL express RFP while Pep1-GFP fluorescence is not detectable. Bar: 5 µm. B: SG200pep1:gfpR penetrating a maize epidermis cell; 24 hpi. The Pep1-GFP signal demarcates the point of penetration and becomes visible in the intracellular hyphal part (arrow). Bar: 5 µm; C: Intracellular growing hyphae of SG200pep1:gfpR showing Pep1-GFP secretion around the tip region; 48 hpi. Bar: 2 µm. D: Tip of intracellularly growing hypha of SG200pep1:gfpR during cell to cell passage. Pep1-GFP strongly accumulates at penetration sites. E: Left panel shows SG200pep1:gfpR during cell to cell passage, 48 hpi. Right panel shows the rupture of the cell wall of the same cell inflicted by the penetrating fungal hyphae (arrow); Bars: 2 µm. Pictures A, B and C are maximum projections of confocal stacks. Green: Pep1-GFP; red: RFP; grey: plant cell wall autofluorescence induced by UV-laser. In D a confocal snapshot of a single optical layer is shown.

