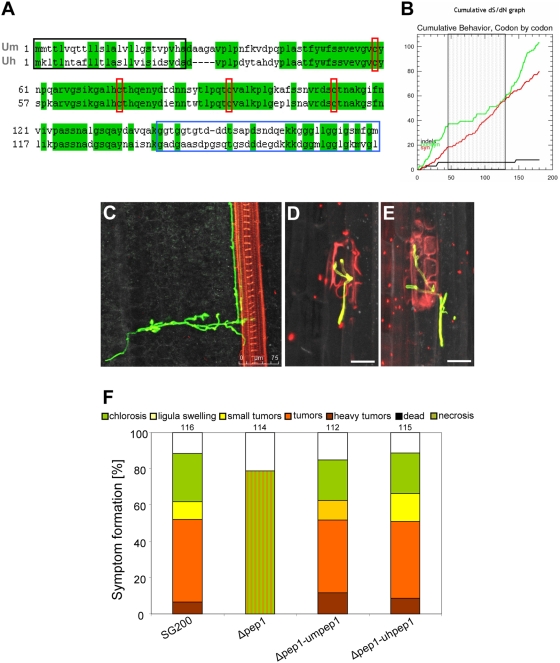
Figure 8. Pep1 is conserved among U. maydis and U. hordei.
A: Sequence alignment of U. maydis Pep1 (Um) and U. hordei Pep1 (Uh). Identical amino acids are highlighted in green. Red boxes: conserved cysteine residues; black box: putative N-terminal secretion signal; blue box: poorly conserved glycine-rich C-terminal region. B: Cumulative plot of synonymous (red line) / non-synonymous (green line) substitutions in Pep1 from U. maydis and U. hordei. Calculation was done using the SNAP software tool (http://www.hiv.lanl.gov/content/sequence/SNAP/SNAP.html). Whereas the N-terminal and C-terminal parts of the proteins show a high ratio of non-synonymous substitutions, the central part of Pep1 (hatched box) shows a preference for sequence conservation. C–E: Confocal maximum projections of U. hordei 4 dpi in Golden Promise barley plants. C: Hyphae of strains 4875-5 crossed with 8a inside the leaf tissue. Hyphae (stained by WGA-AF488; green) show directed growth towards a vascular bundle (stained by propidium iodide, red). D, E: Infection by U. hordei Δpep1 strains 4 dpi (8aΔpep1×4875-5Δpep1) reveals successful penetration into epidermal cell, collapse of the invaded epidermis cell and no further proliferation in the plant tissue. Hyphae were stained by WGA-AF488 (green); dead plant cells are stained by propidium iodide (red). Bars correspond to 25 µm. F: Disease rating of Early Golden Bantam maize plants 12 days after infection with U. maydis strains SG200, SG200Δpep1 (Δpep1), SG200Δpep1-pep1 (Δpep1-umpep1) and SG200Δpep1-uhpep1 (Δpep1-uhpep1). Abbreviations of the respective strain designations are given in brackets. Numbers indicate the total number of plants infected in three independent experiments. The categories for the disease rating are given above. For details of the disease rating see Materials and Methods.

