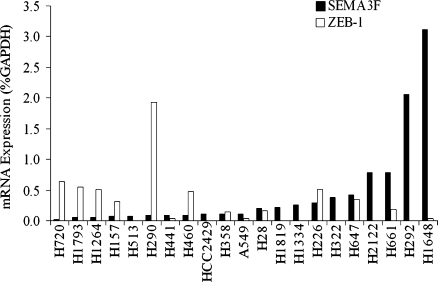
Figure 1.
ZEB-1 expression is negatively correlated with SEMA3F in lung cancer cell lines. ZEB-1 (white bars) and SEMA3F (black bars) mRNA were measured by quantitative real-time RT-PCR in 21 lung cancer cell lines. Values are expressed as percentage of GAPDH expression. Because the variables are not normally distributed, we used the Spearman correlation coefficient (a nonparametric analog to the Pearson correlation coefficient) for statistical analysis.

