Figure 3.
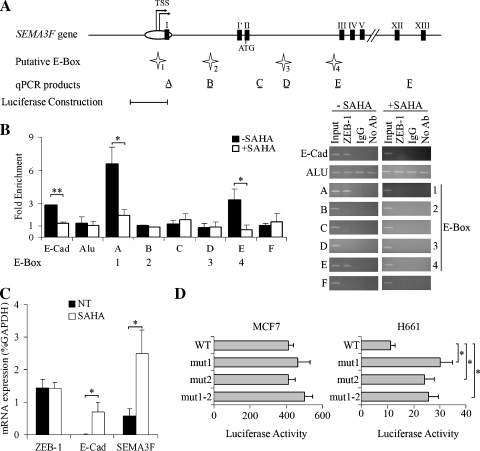
ZEB-1 binds directly to SEMA3F promoter and HDAC inhibition represses this binding in H661 cells. (A) Genomic organization of the SEMA3F promoter. Transcription start sites (TSS) are indicated by arrows. White oval indicates the CpG island, and black boxes indicate exons. Four putative E-box sites, numbered 1 to 4 (indicated by white stars) were predicted by computer analysis using Mulan and multiTF at NCBI DCODE.org (www.dcode.org) [51]. Horizontal black bars show the position of PCR products after ChIP experiments, with their name (A to F) indicated above. The SEMA3F promoter fragment [-5836 to -4013] tested in the luciferase reporter construction is indicated below. (B) Chromatin immunoprecipitation assays were done on H661 cells grown 16 hours in the absence (black bars) or in the presence (white bars) of 5 µM SAHA. E-Cadherin and Alu PCR, respectively, were used as positive and negative ChIP controls. The results of quantitative real-time PCR are expressed by fold enrichment, for three independent experiments with PCR reactions being performed in duplicate. Bars, SD. Semiquantitative analysis of PCR products obtained after ChIP assays was performed by electrophoresis on agarose gel after 30 cycles for Alu PCR and 33 cycles for all the other PCR. (C) ZEB-1, E-Cadherin, and SEMA3F mRNA levels were measured by quantitative real-time RT-PCR on H661 cells grown 16 hours in the absence (black bars) or in the presence (white bars) of 5 µM SAHA. This experiment was done three times, and each RT-PCR in duplicate. Values are expressed in percentage of GAPDH expression. Bars, SD. (D) The luciferase reporter constructions, with the [-5836 to -4013] SEMA3F promoter fragment, mutated or not (WT) for each or both elements of the E-box site 1 present in this fragment, were transfected into MCF7 and H661 cells. Firefly luciferase activity was measured and normalized to the Renilla luciferase activity of the cotransfected plasmid pRL-TK for two independent experiments done in duplicate. Bars, SD. Statistical analysis was performed with Student's t-test: *P < .05, P < .01.

