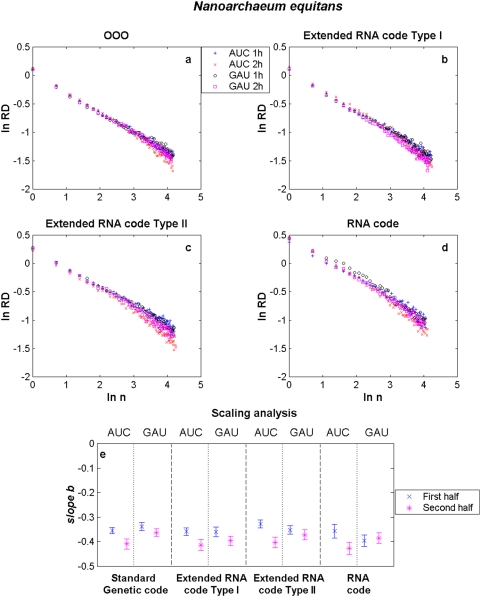
Figure 4. Scaling aggregation analysis of a given codon in the 1st and 2nd halves of each genome of N. equitans.
In each plot of Fig. 2.3(a–d), the  as a function of
  for AAU and AUU in a) the OOO genome; b) the extended RNA code type I, c) the extended RNA code type II, and d) the RNA World. The estimates of the slope
  together with their confidence intervals for each codon in each of the different genomes are illustrated in Fig. 2.3(e). The symbols 1 h and 2 h stand for the 1st and 2nd halves of the genome, respectively.

