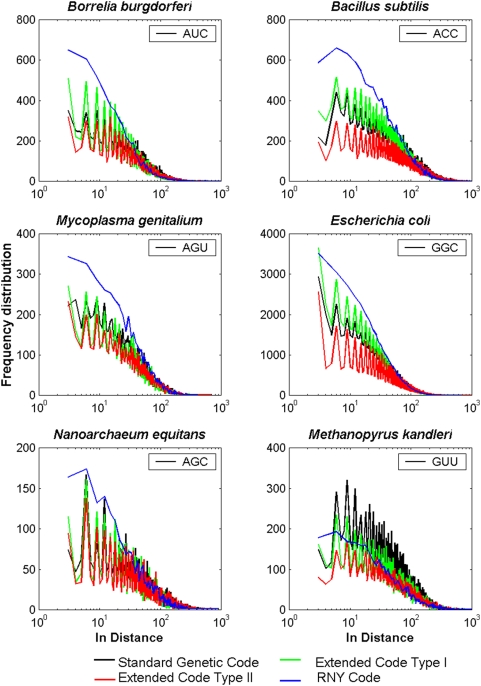
Figure 6. Log-linear plots of the FDD of a given triplet in each genome of a) B. burgdorferi b) B. subtilis c) M. genitalium d) E. coli e) N. equitans f) M. kandleri.
The different colors indicate the SGC (black) of the OOO genomes, the extended RNA code type I (green) and II (red), and the RNA code (blue).

