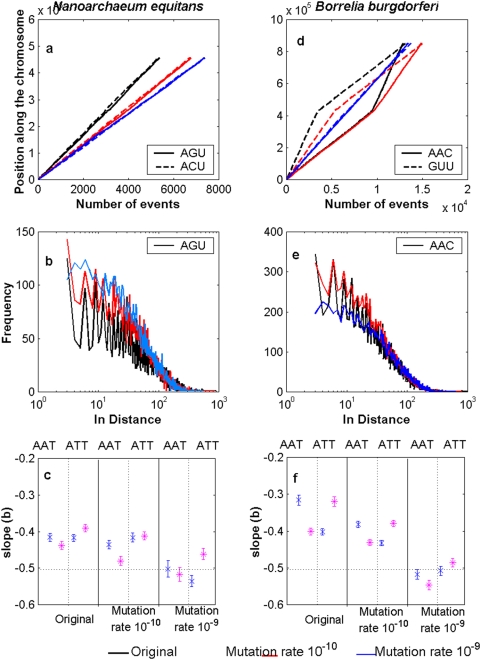
Figure 7. Robustness of current genomes.
In a) CPPs (triplets AGU-ACU), b) FDD (triplet AGU), and c) the estimates of the slope  together with their confidence intervals for the triplets AAT-ATT for N. equitans. In d) CPPs (triplets AAC-GUU), e) FDD (triplet AAC), and f) the estimates of the slope
  together with their confidence intervals for the triplets AAT-ATT for B. burgdorferi. Intact genomes (plots in black) were subjected to computer simulation experiments of random mutations at a rate of 10−10 (plots in red) or 10−9 (plots in blue) per site per year during three billions of years.

