
Figure 4. PI3K/Akt/mTOR/p70S6K signaling regulates insulin-inducible GSH recovery after tBH challenge.
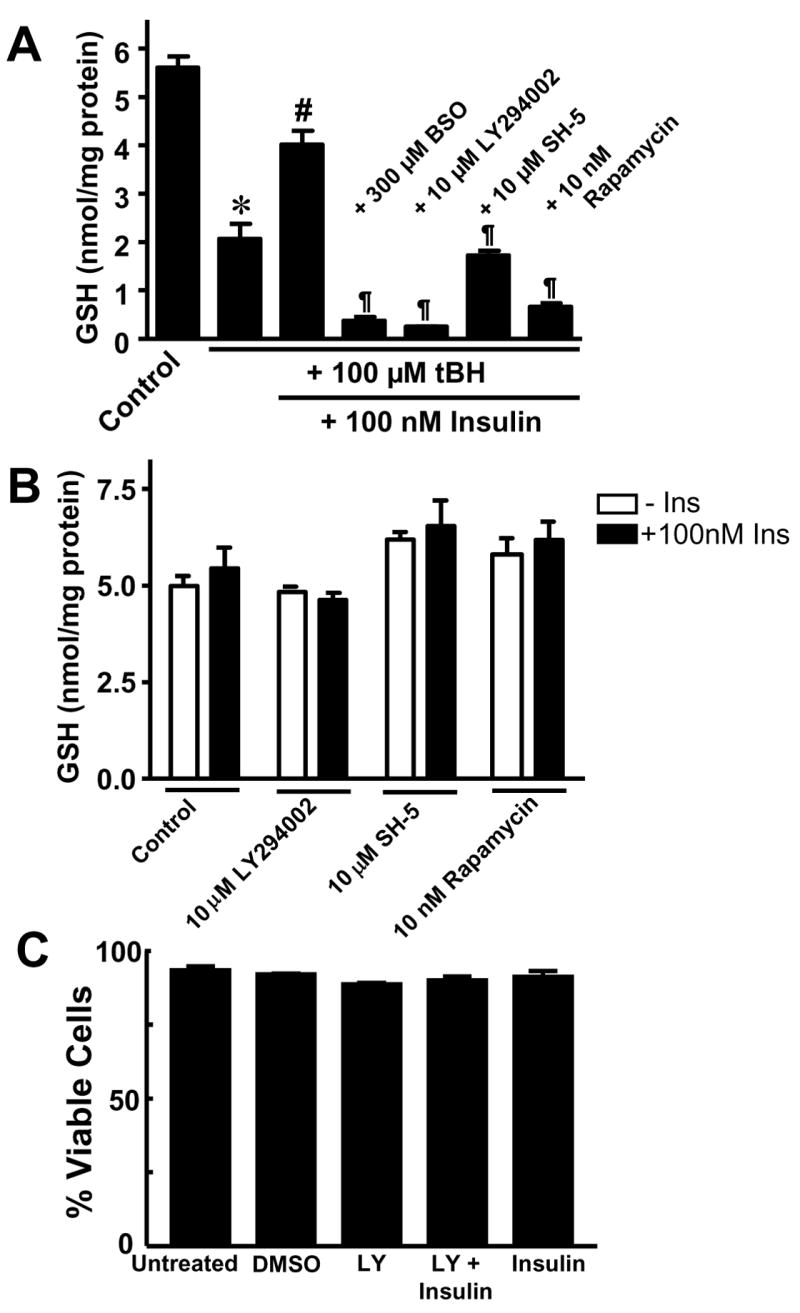
A. Confluent IHEC monolayers were pretreated with either 10 μM LY294002, 10 μM SH-5, or 10 nM rapamycin for 1 hr prior to co-incubation with 100 nM insulin for 48 hrs. Thereafter cells were challenged with 100 μM tBH for 3 hrs and cellular GSH levels were measured at designated times. BSO controls were performed as described in Figure 2C. * p<0.05 vs untreated control; # p<0.05 vs plus 100 μM tBH plus 100 nM Insulin; ¶ p<0.05 vs plus 100 μM tBH plus 100 nM Insulin without kinase inhibitors. B. IHEC monolayers were pretreated with either 10 μM LY294002, 10 μM SH-5, or 10 nM rapamycin for 1 hr prior to co-incubation with 100 nM insulin for 48 hrs, and then cellular GSH levels were measured. C. IHECs were treated with or without 10 μM LY294002, 100 nM Insulin or in combination for 48 hrs and cell viability was assessed by trypan blue exclusion. DMSO served as solvent control. For B & C there was no significant difference among treatment groups by one way ANOVA.