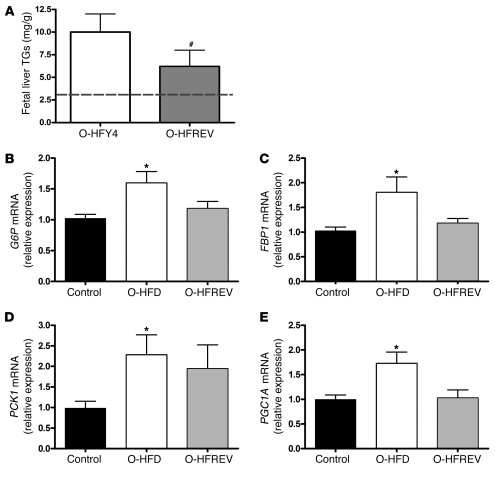
Figure 5. Maternal diet reversal partially prevents the development of fatty liver in the fetal offspring.
(A) Liver TG levels for O-HFY4 and O-HFREV animals. Dashed line represents TG levels in normal control fetal offspring. #P < 0.05 versus O-HFY4 (2-tailed Student’s t test). (B–E) Relative difference in G6P (B), FBP1 (C), PCK1 (D), and PGC1A (E) expression in the fetal liver of control (n = 9), O-HFD (n = 15), and O-HFREV (n = 7) groups. Data were obtained from samples obtained at different times and run in different assays, but were normalized to control samples that were present in every assay. O-HFD values represent the average of both O–HFD-R and O–HFD-S groups from Figure 4. *P < 0.05 versus control (ANOVA with Bonferonni’s multiple comparison test). There was no significant difference between the O-HFREV and either the control or the O-HFD groups.

