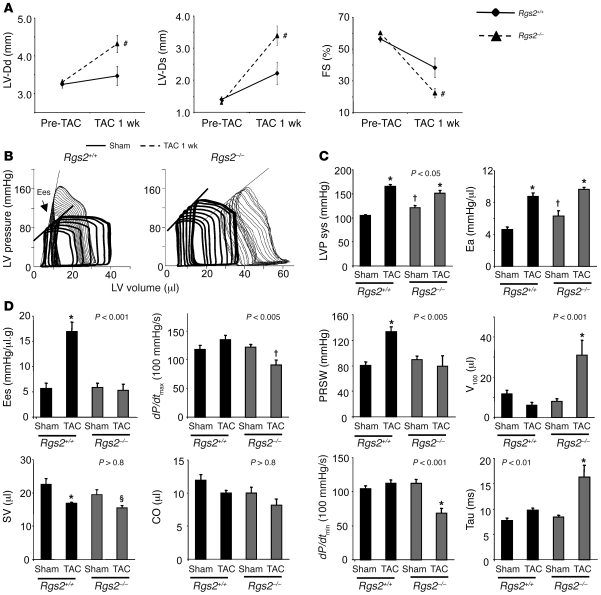
Figure 2. Rgs2–/– hearts display chamber dilation and fail to compensate to TAC.
(A) Echocardiographic data before and after 1 wk TAC (n = 7 per group). LV-Dd, LV end-diastolic dimension; LV-Ds, LV end-systolic dimension. #P < 0.05 versus Rgs2+/+ 1 wk TAC. (B) Representative PV loops during preload reduction by inferior vena cava occlusion in sham (thick line) and 1 wk TAC animals (thin dotted line). Steepness of left upper relation (end-systolic elastance [Ees]) reflected contractile function and was enhanced after TAC in Rgs2+/+ mice, but unaltered with a right-shift (remodeling) of the relation in Rgs2–/– mice. (C) Peak systolic LV pressure (LVP sys) and effective arterial elastance (Ea; an index of total ventricular afterload). Rgs2–/– mice had somewhat higher basal afterload, but both genotypes had similarly increased afterload after 1 wk TAC (n = 5–7 per group). P value shown is for interaction of genotype and condition. *P < 0.05 versus sham; †P < 0.05 versus Rgs2+/+ sham. (D) Summary data obtained from PV loop analysis shown in bar graphs. P values shown are for interaction of genotype and condition (2-way ANOVA). *P ≤ 0.001, †P < 0.05 versus sham. V100, volume position (end-systolic volume at common end-systolic pressure — 100 mmHg — derived from end-systolic PV relation); dP/dtmax, peak rate of LV pressure rise; PRSW, preload recruitable stroke work; dP/dtmin, peak rate of LV pressure decline; Tau, relaxation time constant; SV, stroke volume; CO, cardiac output. P values shown are for interaction of genotype and condition (2-way ANOVA). *P < 0.05, §P = 0.06 versus sham; †P < 0.05 versus corresponding Rgs2+/+ TAC and Rgs2–/– sham (1-way ANOVA).

