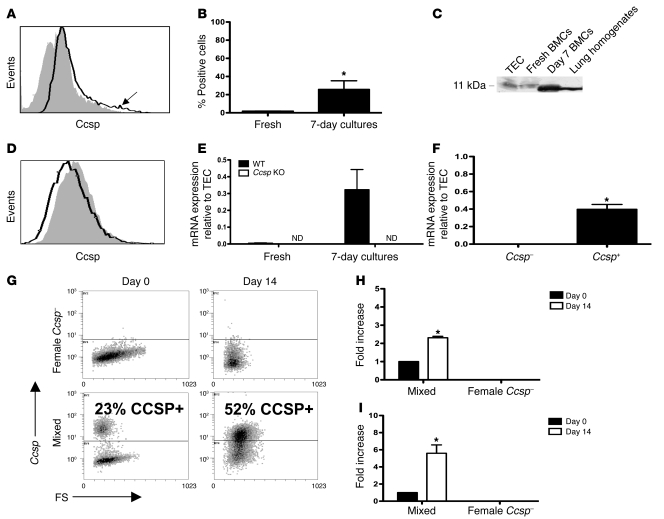
Figure 1. Identification of a bone marrow Ccsp-expressing population.
(A) Representative flow histograms (solid black line) of freshly isolated BMCs compared with isotype staining (gray histogram) show a small population (arrow) of BMC-expressing Ccsps. (B) Freshly isolated bone marrow contained approximately 2% Ccsp+ cells, which expanded in culture after 7 days to approximately 25% Ccsp+ (*P < 0.001). n = 8 per group. (C) Western blot analysis confirmed the presence of an 11-kDa band (tracheal epithelial cells [TECs] were loaded with 10% of the protein used for BMCs and lung homogenates) and in BMCs freshly isolated or cultured for 7 days. (D) No Ccsp+ BMC population was detected in Ccsp knockout mice. Solid black line indicates Ccsp antibody; gray histogram indicates isotype staining. (E) Real-time PCR confirmed the presence of a Ccsp gene transcript in freshly isolated and cultured BMCs of wild-type but not Ccsp knockout animals. ND, not detectable. Gapdh was used as a housekeeping gene for normalization of expression levels. Each bar represents normalized levels relative to tracheal epithelial cells. n = 4 per group. (F) Real-time PCR detected Ccsp gene expression in Ccsp+ but not Ccsp– cells. n = 12 per group; *P < 0.01 compared with freshly isolated cells. (G) Female Ccsp– cells cultured alone on plastic for 14 days showed no detectable Ccsp+ cells, while a mixed population showed an increase in Ccsp+ cells after 14 days in culture. (H) Real-time PCR showed a 2.5-fold increase in Sry mRNA after 14 days in culture in the mixed population. (I) The increase in Ccsp+ cell number corresponded to an increase in Ccsp mRNA. Each bar represents mean ± SEM (n ≥ 3). *P < 0.01 compared with Ccsp– cells.

